NASA Logo, National Aeronautics and Space Administration

Atmospheric Chemistry and Dynamics Laboratory (Code 614)

For Our Colleagues
Scientific/Technical Information

GEOS-5 Chemical and Aerosol Constituent Forecasts

Today's Aerosols

Today's Aerosols: Click for larger image 
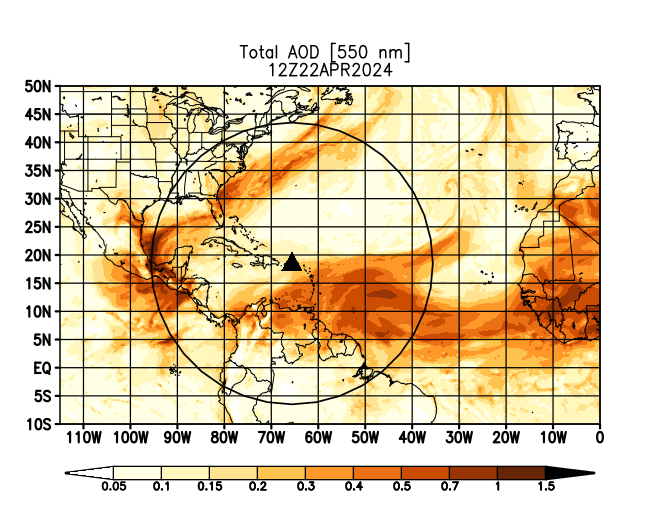
Latest 5-day Aerosol Forecast in Google Earth

Today's CO

Today's CO: Click for larger image Latest 5-day CO 150 hPa Forecast in Google Earth
Latest 5-day CO 300 hPa Forecast in Google Earth

Welcome to the homepage for NASA GSFC Code 614 and GMAO chemical constituent forecasts. Results are shown for forecasts run with the GEOS-5 model. Assimilation of aerosol optical thickness based on MODIS is included. Please note that these forecasts are considered "experimental" and so should not be published. Please contact the web curator with any questions.

Useful Links

GEOS-5 System Configuration (based on GloPac configuration)
NASA GSFC Code 614/Atmospheric Chemistry and Dynamics
NASA GSFC Code 610.1/Global Modeling and Assimilation Office
NASA HS3 Mission Page

Page Sections

Today's Aerosols and CO
Animations of Constituent Fields
Static Plots of Constituent Fields
Notes and Descriptions Explaining the Model


Animations of Constituent Fields

Click a link below for animations
Aerosol AOD (5-day forecast)
SO2 (5-day forecast)
CO (5-day forecast)

test totaltautest duexttautest ssexttautest suexttautest bcexttautest duslicetest ssslicetest suslicetest bcslicetest so2cmasstest so2leveltest so2slicetest cldtottest cldlowtest cldmidtest cldhghtest cloudslicetest coleveltest cobbglleveltest cobbaeleveltest cobbafleveltest cobblaleveltest cobbnaleveltest conbglleveltest conbasleveltest conbeuleveltest conbnaleveltest coslicetest co2leveltest co2slicetest cfcleveltest cfcslicetest qvleveltest qvslicetest o3leveltest o3coltest Dakartest Capo_Verdetest Saint-Louis_Senegaltest Merzouga_Morocco

Static Plots of Constituent Fields

To view model forecasts of the following variables, please select as many from the list as you would like to see, scroll down to select a date, and click "Show Plots!"

Aerosol

Total Aerosol Optical Thickness
Level: Total Atmosphere
Dust Aerosol Optical Thickness
Level: Total Atmosphere
Seasalt Aerosol Optical Thickness
Level: Total Atmosphere
Sulfate Aerosol Optical Thickness
Level: Total Atmosphere
Carbonaceous AOT
Level: Total Atmosphere
Dust Vertical Cross-Section
Bearing along: North-South East-West
Sea Salt Vertical Cross-Section
Bearing along: North-South East-West
Sulfate Vertical Cross-Section
Bearing along: North-South East-West
Carbonaceous Vertical Cross-Section
Bearing along: North-South East-West

Sulfur Dioxide (SO2)
SO2 is a precursor gas to sulfate aerosol formation, and in produced from natural (e.g., volcanic) and man-made sources.
SO2 Column Loading
Level: Total Atmosphere
SO2 Mixing Ratio
Pressure Surface (hPa): 850 700 300 150 100
SO2 Vertical Cross-Section
Bearing along: North-South East-West

Carbon Monoxide (CO)
Several tags of CO are presented, segregated by geographic region and emissions (FF=fossil fuel, BB=biomass burning).
CO Mixing Ratio (Global, All Sources)
Pressure Surface (hPa): 850 700 300 150 100
CO Mixing Ratio (Global BB)
Pressure Surface (hPa): 850 700 300 150 100
CO Mixing Ratio (Asian/European BB)
Pressure Surface (hPa): 850 700 300 150 100
CO Mixing Ratio (African BB)
Pressure Surface (hPa): 850 700 300 150 100
CO Mixing Ratio (Central/S. American BB)
Pressure Surface (hPa): 850 700 300 150 100
CO Mixing Ratio (North American BB)
Pressure Surface (hPa): 850 700 300 150 100
CO Mixing Ratio (Global FF)
Pressure Surface (hPa): 850 700 300 150 100
CO Mixing Ratio (Asian FF)
Pressure Surface (hPa): 850 700 300 150 100
CO Mixing Ratio (European FF)
Pressure Surface (hPa): 850 700 300 150 100
CO Mixing Ratio (North American FF)
Pressure Surface (hPa): 850 700 300 150 100
CO (all sources) Vertical Cross-Section
Bearing along: North-South East-West

Carbon Dioxide (CO2)
CO2 Mixing Ratio
Pressure Surface (hPa): 850 700 300 150 100
CO2 Vertical Cross-Section
Bearing along: North-South East-West

CFC12
CFC Mixing Ratio
Pressure Surface (hPa): 850 700 300 150 100
CFC Vertical Cross-Section
Bearing along: North-South East-West

Ozone
Ozone Mixing Ratio
Pressure Surface (hPa): 850 700 300 150 100
Ozone Column
Level: Total Atmosphere

Water Vapor
Water Vapor Mixing Ratio
Pressure Surface (hPa): 850 700 300 150 100
Water Vapor Vertical Cross-Section
Bearing along: North-South East-West

Sites AOT/Surface Mass Concentration
Dakar
Level: Total Atmosphere
Capo Verde
Level: Total Atmosphere
Saint-Louis, Senegal
Level: Total Atmosphere
Merzouga, Morocco
Level: Total Atmosphere

Pick a date
Your selection is the particular forecast you want to view. You will subsequently be shown plots for the nearest model point and the following 5 days of the forecast.
Year: Month: Day: Hour:


Notes:

Model runs are generated with the NASA GEOS-5 General Circulation Model with its meteorological data assimilation system. On this page we present results for aerosols, CO (carbon monoxide), and CO2 (carbon dioxide). The aerosol package is based on GOCART [Chin et al., JGR, 2002; Colarco et al., JGR, 2010] and contains dust, seasalt, sulfate, black carbon, and organic carbon aerosols. Biomass burning sources of carbonaceous aerosols, CO, CO2, and SO2 are determined in near real-time (and propagated forward in time for forecasts) from MODIS imagery and land mapping. Peter Colarco and Arlindo da Silva are responsible for the aerosol component. Randy Kawa and Huisheng Bian are responsible for the CO and CO2 components. Arlindo da Silva is responsible for the biomass burning sources. Peter Colarco is responsible for the web page.